The Relative Strength Index (RSI) is one of the many technical indicators used to analyze financial markets. It charts historical and current strength/weakness of securities on the basis of the closing price of the previous trading session.
The RSI comes under the category of momentum oscillator as it measures the magnitude and velocity of price movements within markets. Momentum refers to the rate at which the price of assets and securities fall and rise. The RSI calculates momentum in the form of ratios of high close to low close. Accordingly, the RSI of stocks that have experienced positive market movements is higher than that of stocks that have experienced negative market movements.
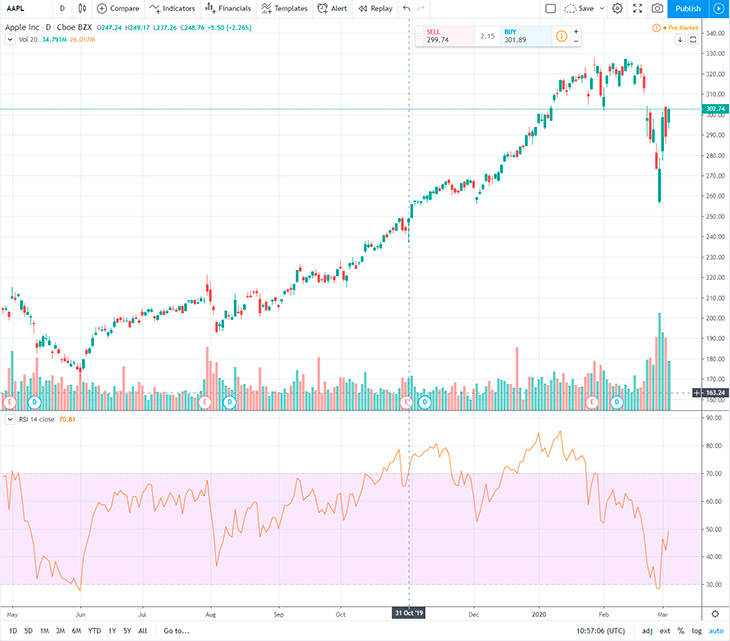
Usually, the RSI is measured on 14-day timeframes and read on a 0 – 100 scale, with the lowest level being 30 and the highest level being 70. Rarely, you will see extreme high/low levels of 80/20 or 90/10, for example, but in case this happens, you have to conclude that the momentum of the security is very strong at the moment.
To put it very simply, the RSI signals investors when it is the right time to buy or sell currencies or securities. When the security is oversold, it is time to buy. When it is overbought, it is the time to sell.
- How Useful is the RSI in Trading?
- History of the Oscillator
- RSI vs. Relative Strength
- The Relative Strength Index (RSI) – What Information Does It Reveal?
- How to Use RSI? Tips for Traders
- How to Calculate the RSI
- Drawbacks of the RSI
- Relative Strength Index FAQs
- Conclusion: Practice RSI Trading on Demo Account
How Useful is the RSI in Trading?

An attempt to answer this question was made by a couple of researchers called Patrice Marek and Blanka Sediva of the University of West Bohemia in September 2017. The researchers compared four trading strategies—RSI using parameters optimized for each trading day, RSI with recommended parameters, the Kelly gambling strategy, and the traditional buy-and-hold strategy.
For the purpose of simulations, they used companies included in the S&P 500 Index in 2006 – 2009 for largest weighting. They performed 10,000 simulations for each of the above-mentioned four strategies, and their tests showed that the RSI is indeed very useful for traders. In fact, RSI trading strategies can produce more profitable results than the simple buy-and-hold strategy.
History of the Oscillator

The man behind the Relative Strength Index was J. Welles Wilder, who wrote all about it in a book titled “New Concepts in Technical Trading Systems,” which was published in 1978. Details about the indicator were also published in the June 1978 issue of Commodities Magazine, which is now published as Futures Magazine.
Wilder is a former Navy mechanic, who later became a mechanical engineer. After trading commodities for several years, he started studying technical analysis very seriously. In 1978, he published the results of his studies, “New Concepts in Technical Trading,” in which he spoke about the Relative Strength Index (RSI), the brand new momentum oscillator that he had developed.
It did not take long for the RSI to gain popularity among seasoned as well as aspiring traders. Today, it is considered to be one of the most important technical analysis tools in the trading world. Some RSI practitioners continued Wilder’s work and developed the concept further. One of these practitioners is James Cardwell, who taught the world how to use RSI to confirm trends.
RSI vs. Relative Strength
The Relative Strength Index (RSI) is not to be confused with Relative Strength. In fact, there is hardly any connection between the two. Beginners tend to get confused with the two concepts because their names are similar.
The RSI is best defined as a momentum oscillator used to measure the ups and downs of closing days over a specific time frame, usually 14 days, presenting scores in the range of 0 – 100 and displaying the oversold and overbought levels of securities.
On the other hand, Relative Strength is a concept used to make a comparative study of two types of investment. It compares the price of one investment against the other and displays the strength/weakness of each investment in comparison to the other.
RSI helps you to measure stock price movements over 14-day time frames so that you can better understand market movements, volatility, and price fluctuations. Relative Strength helps you compare the performance of asset classes, helping you to choose from ETFs, stocks, options, mutual funds, and others for investment.
Relative Strength is a tool that helps traders and investments choose the right stocks, commodities, or FX pairs to invest in. It is essential because manually analyzing the performance of each stock against the other or various forms of investment is a time consuming task.
While RSI helps you to analyze the performance of an individual stock, Relative Strength helps you to pick a winner or a group of winners from a huge ocean of stocks, shares, commodities, bonds, mutual funds, and others without having to analyze each one individually.
The Relative Strength Index (RSI) – What Information Does It Reveal?
The Relative Strength Index (RSI) is a popular trading tool as it reveals the following information:
- Overbought and Oversold Levels: As previously mentioned, RSI values are read on scale of 0 – 100. If the stock continues to fall throughout the 14-day time frame, its RSI value will be zero. If the stock continues to rise throughout the 14-day time frame, its RSI value will be 100. You can, therefore, use RSI values to identify a stock’s overbought and oversold levels.
According to most technical analysts, an RSI value that exceeds 70 is considered to be overbought and an RSI value that falls below 30 is considered to be oversold. But traders cannot afford to take these levels on face value. They have to keep adjusting them according to the stock’s inherent volatility.
It is possible for extremely volatile stocks to reach the pre-established overbought and oversold levels more frequently than stable stocks that easily maintain the 70/30 levels.
- Failure Swings: Those who use indicators such as the RSI to trade short term are usually confused with the fact that the price of the stock continues to rise although the RSI reaches the overbought level. Conversely, the price of the stock continues to fall although the RSI reaches the oversold level. To deal with this issue, Wilder developed another concept, the failure swing.
Whenever the RSI exceeds the overbought level of 70, it is said to be a bearish failure swing. And whenever the RSI falls below the oversold level of 30, it is said to be a bullish failure swing. Traders can hold short positions only when the RSI displays a bearish failure swing. You can easily view these bullish and bearish failure swings when you study a stock’s RSI chart.
Failure swings can also take place well over the RSI value of 70. When this happens, traders have to create a new lower level over 70. For example, if the RSI shows a value of 76 before jumping back to 72 and then shooting up to 78, a failure swing is said to have taken place when the RSI value falls below 72. Similarly, failure swings can also take place below 30.
- Divergence: There is a positive divergence when the RSI value creates a higher bottom level even when the price keeps falling, and there is a negative divergence when the RSI value creates a lower top level even when the price keeps rising.
- Trend: Investors make their profits when they trade according to the trend, and this is where the RSI can help them as it can determine and confirm market trends. For example, stocks displaying a strong uptrend hardly fall below an RSI value of 40.
When this happens, it is a signal for the trader to buy. When the RSI value approaches 80, it is a signal to the trader to take a square off position. Traders should avoid going short on stocks that are on an uptrend.
Stocks on a strong downtrend usually get an RSI value ranging from 60 – 20, and you can short sell when the value touches 60.
The trend of stocks and assets help you to properly read, understand, and analyze the values displayed by the RSI. According to Constance Brown, a widely acclaimed technical analyst, oversold RSI readings during an uptrend are usually more than 30 and overbought RSI readings during a downtrend are lower than 70.
Focusing on trading techniques and signals conforming to the market trend is a concept that is related to using trend appropriate overbought/oversold levels. When traders use bullish signals when stock prices are in a bullish trend and bearish signals when stock prices are in a bearish trend, they can avoid a number of false alarms that the RSI can raise.
- Support and Resistance Levels: In many cases, the RSI displays levels of support and resistance more clearly than the price of the securities. Wilder says that RSI should be used with bar charts to get valuable inputs that can help draw inferences from charts.
To sum up, the major principles of analyzing RSI charts are as follows:
- RSI levels exceeding 70 or falling below 30 indicates that the stock is overbought or oversold, respectively. The trends of such stocks are bound to reverse.
- A bearish or a bullish divergence usually leads to a trend reversal. When the RSI value of a stock reaches a new high level, it results in a bearish divergence. When the RSI value of a stock reaches a new low level, it results in a bullish divergence.
- Failure swings provide trading signals. When the RSI exceeds 70, then falls below that level, shoots up again, and breaks the support line, it is considered to be bearish failure swing. The reverse is a bullish failure swing.
- RSI charts display specific patterns. If there is a deviation from these patterns on daily RSI charges, it usually happens a day or two before the price breakout. This gives swing traders valuable information well in advance.
When the above four are considered together, traders get a very strong signal to either buy or sell. If a stock exceeds the RSI value of 70, generates bearish divergence, displays a descending triangle top pattern, and completes a failure swing, you are bound to notice changes in its price chart.
According to “New Concepts in Technical Analysis,” trend lines displayed on the bar chart correspond to support lines on RSI charts. The trend line analysis can be used to interpret RSI lines. If there is a break in the trend lines, you are sure to see changes on the price chart.
How to Use RSI? Tips for Traders

Being a versatile technical analysis tool, the RSI can be used to generate buy/sell signals, view overbought/oversold conditions, confirm price movements, and learn about a potential reversal in price through divergence.
- Buy/Sell Signals: The RSI exceeding the oversold line of 30 is a clear buy indication. The RSI falling below the overbought line of 70 is a clear sell indication. The time frame of the RSI can be changed to increase or reduce the number of buy/sell signals. When the RSI time frame is decreased, the volatility of stock, commodity, or currency pair increases, thereby increasing the number of buy/sell signals.
- Divergence: Divergence is another way to interpret RSI buy/sell signals.
Traders may choose to buy when the RSI and price are both rising and the RSI shoots above the level of 50. Similarly, traders may choose to sell when the RSI and price are both falling and the RSI falls below the level of 50. Traders can use divergences to confirm price movements and predict future reversals in price trends.
- Technical Analysis: Technical analysis is the key to understanding the RSI indicator better. Technical analysts study charts of previous market movements and compare them with current ones to predict future market trends and price movements. Technical analysis is interested in market history and predictions for the future. It considers a variety of factors such as the price of various instruments. It then uses this data to create charts.
Technical analysis gives traders the ability to follow multiple markets and instruments at the same time. Before actually attempting to study the RSI indicator, you must understand the following major principles of technical analysis:
- A trader’s biggest friend is trend. You can use technical analysis to identify significant market patterns. Each market pattern predicts a specific result. At the same time, there are certain market patterns that get repeated consistently.
- Traders can learn a lot from market histories, especially as they are in the habit of repeating themselves. The way patterns have been repeating in Forex charts over the last 100 years clearly indicates that people have hardly changed.
- The price of an asset or security reflects all the known market factors that can have an impact on it. Some of these market factors include political factors, economic policies, market sentiments, supply and demand, and so on.
Pure technical analysis is concerned only with price flows, not with the factors responsible for those flows. And technical analysis depends heavily on the Relative Strength Index (RSI) indicator.
- The Center Line: All momentum oscillators, and this includes the RSI, have center lines that are often ignored. The RSI’s center line is right in the middle of the chart, showing a reading of RSI value 50. Experienced FX traders use this line to understand trend shifts. The market momentum is considered to be up if the RSI shows a value exceeding 50. This presents plenty of buy opportunities for traders. If the RSI shows a value below 50, it is indicative of bearish trends in the market.
- RSI Overbought/Oversold Levels: An RSI value that is lower than 30 indicates that the stock is oversold, and an RSI value that is higher than 70 indicates that the stock is overbought.
An oversold signal predicts increase in price. You can enter a trade after confirming a reversal. An overbought signal predicts fall in price, and after confirming the reversal, you can exit the trade.
The above-mentioned midline of 50 separates the bearish and bullish territories of the RSI chart. An RSI value of above 50 indicates that the stock is in uptrend, and an RSI value of below 50 indicates that the stock is in downtrend.
- Two Period Divergence: There is a huge difference between RSIs over a 14-day time frame and RSIs over a five-day time frame. In case of RSI 14, the market does not touch the overbought/oversold levels before a major price flow. In case of RSI 5, the chart reacts to the latest price flows and displays the earliest signs of price reversals.
Apply RSI 5 over RSI 14 and check for crossovers. If RSI 5 crosses over RSI 14, it means that the latest stock prices are going up, and this is a clear signal for you to buy. If RSI 5 crosses below RSI 14, it indicates that the latest stock prices are going down, and this is a clear signal for you to sell.
- The Trend Line: When you connect points on the top and bottom RSI lines, you get the trend line. You have to connect at least three points on the RSI line when it goes up to get an uptrend line. You get a downtrend line when you connect at least three points on the RSI line when it comes down.
Breaks in the RSI trend line indicates that the price will either continue to rise or suddenly reverse. Breaks in RSI trend lines predict breaks in price chart trend lines. This enables you to easily predict a reversal or price rise and an early opportunity to make a profit.
- Classic Divergence: When the price reaches a higher high, a bearish divergence is created. When this happens, the RSI falls and touches a lower high level. Usually, traders notice divergences being created when the market turns bearish, and this is where the pattern begins to reverse.
Traders expect reversals as soon as an RSI divergence is formed. It serves as a reversal warning in advance. You can see it appearing in candlestick charts just before the uptrend turns into a downtrend and the price plunges beyond the support level.
The converse is also true. When the price falls to a lower low, a bullish divergence is created on the RSI chart and the RSI value turns into a higher low. This is a warning in advance of a trend reversal in the near future and that the downtrend will soon turn into an uptrend.
How to Calculate the RSI

The basic components of the Relative Strength Index (RSI) are Relative Strength, Average Loss, and Average Gain. By default, the RSI is calculated over a period of 14 days although traders can reduce or increase this time frame.
First, the average gain and average loss over a period of 14 days are calculated. The average gain is, therefore, the sum of all gains in the past 14 days divided by 14. The average loss is the sum of all losses in the past 14 days divided by 14. The other calculations are based on the present gain loss and the previous averages.
The average gain is thus the previous average gain multiplied by 13 plus the current gain divided by 14. The average loss is the previous average loss multiplied by 13 plus the current loss divided by 14.
Calculating previous values with the present values is a technique that is also used in calculating other indicators such as moving averages. The accuracy of the RSI value, therefore, sharpens as its calculation period extends.
Since the RSI is measured in a range of 0 – 100, one can easily identify its extremes. Thus, the RSI becomes zero when the average gain becomes zero. Assuming that the RSI is on a 14 day time frame, a zero value indicates that the asset price has gone lower during all the 14 days. When the average loss is zero, the RSI value turns 100, indicating that the asset price has moved up during all the 14 days.
Drawbacks of the RSI

The RSI is not a human being with intelligence of its own. It is a tool that does the work that it has been programmed to do. Just like any other indicator, it may fail when real-time market conditions do not agree with what it says.
Markets are sometimes irrational, unpredictable, and dynamic. Technical indicators such as the RSI can only make indications, not predictions. The RSI is not a magic indicator than can tell you the correct time to enter or exit a trade position.
If there was indeed such a magic tool, everybody would have used it to make money from trading. Also, there wouldn’t be any dynamic market and innumerable trading opportunities as everybody would use this magic tool enter and exit trades and hold positions at the same time.
The RSI lists out possibilities and probabilities. A trader may glance at the RSI chart and say that the RSI value of a stock is overbought at 70, but there are possibilities of it going higher than that.
Based on their knowledge of economic policies, the latest news, and the work they have done with other indicators, they may say that the stock looks oversold on the RSI chart, but the sector is likely to recover at any time.
The RSI’s overbought/oversold levels are not an accurate reflection of the market because of the inverse relationship between market trends and the RSI. For this reason, the RSI value falls whenever the market experiences an uptrend and increases whenever the market experiences a downtrend. Also, the RSI is best used in oscillating markets as it is a momentum oscillator.
Relative Strength Index FAQs

The following are some commonly asked questions about RSI:
Q1: What other trading tools can I use along with the RSI?
A: As its name indicates, RSI is a measure of the relative strength of underlying markets. Traders commonly use RSI to predict trend reversals. While doing so, using other trading tools such as trend line analysis and candlestick analysis can be of great help.
Q3: What type of markets can you apply RSI to?
A: RSI is a technical tool that can be applied while trading any market. However, traders prefer applying it to large and liquid markets such as commodities, stocks, and Forex currency pairs.
Q3: Which time frame is best for RSI—14-day or 5 day?
A: It largely depends on your trading goals, plans, and strategies. Most traders prefer setting RSIs to time frames in the range of 2 – 6. The default time frame is 14 days and it suites several market situations. But advanced and intermediate traders can always increase or decrease the time frame depending on whether they would like to enter a long-term or a short-term trade.
Q4: Is the RSI index really useful?
A: The RSI is one of the most popular trading tools in the world. It falls into the category of momentum oscillators and can help determine a number of market situations such as trade entries and exits, trend, price flows, and others.
Q5: Which indicator works best with RSI?
A: Advanced traders use a number of other technical indicators such as moving averages and moving average convergence divergence (MACD) with RSI. It helps them get a better idea of their trading position and to accurately predict price flows.
Q6: Which is better: MACD or RSI?
A: Unlike RSI, MACD does not give you any upper or lower limits. Since RSI values are always measured in a scale of 0 – 100, it is easier for traders, even beginners, to understand and follow RSI. If you are aiming at going long on a position, the MACD is more powerful than the RSI as it works on longer timeframes and helps compare highs and lows in market history.
Conclusion: Practice RSI Trading on Demo Account
Serious technical analysts have been continuously using the Relative Strength Index (RSI) for more than 40 years. The momentum oscillator has proved to be of great value for profit-minded traders.
The hard work that Wilder did on market momentum created the foundation for analysts and chartists of the future to delve deeper into the concept and explore the RSI’s correlation with underlying price flows.
All this makes the RSI one of the top trading indicators or tools to develop a profitable trading strategy. Just a glance at the RSI equips you with the ability to predict market trends and price flows.
You must understand that the RSI can be interpreted differently by different traders. According to Wilder, bullish divergence was indicative of an upward price flow in the market. According to Cardwell, however, bullish divergence indicated a small correction in the price of a stock as it continued on its downward trend.
If you are serious about trading, you must spend a lot of time experimenting and researching with the RSI. On no account should you rely on it as your only source of information. When you use it wisely, it will prove to be your greatest ally, a reliable measure of market depth, velocity, and price.
Avoid plunging headlong into live trading with the RSI. New traders tend to make the mistake of beginning to trade real money before testing a variety of parameters or learning how to interpret an indicator correctly. Their intention is only to make money at the earliest possible, and this is the worst way possible to use any indicator, not just the RSI.
When you understand the formula on which it is based and learn to apply it correctly, the RSI can surely help you to predict price flows and market trades, overbought/oversell levels, and the best time to enter and exit trades. The RSI can also indicate the most active trading sessions and give you information to determine support and resistance levels. Proper use of the RSI can give you information about trends and buy/sell signals.
However, we do not advice beginners to plunge into real money RSI trading right away. Find a reputed online broker and open a demo account. Spend a few months practicing RSI trading on your demo account and migrate to a live account as soon as you are confident that you have gained the required knowledge, training, and expertise.
If you want to know more about RSI trading, you will find ample educational resources in the form of training videos, articles, electronic courses, eBooks, and webinars at the most reputed online brokers.