Forex traders have to implement proper trading strategies or plans to enjoy success in trading and make a profit. If they want to become successful, they must use tools that help them to make the correct trading decisions.
Indicators are tools that can influence trading decisions. The best FX brokers give traders access to several varieties of FX indicators such as leading indicators, lagging indicators, and confirming indicators. Among the most popular varieties of FX indicators are moving averages (MA), relative strength index (RSI), and average true range (ATR).
However, it is worth mentioning that indicators, on their own, are not of much use to traders. In order for them to work, they have to fit into a trader’s trading strategy or plan.
Best Forex Technical Indicators
Forex technical analysis indicators serve the purpose of predicting price movements in the FX market. They are calculated on the basis of price and volume of the financial instrument. Traders can use them to make important trade decisions, such as entry and exit points of a trade. Popular FX trading platforms such as MetaTrader 4 allow traders to place indicators on trading graphs or special windows.
Here are some of the most popular forex technical indicators:
Moving Average (MA) – These are trend indicators that help traders to identify and follow trends. They show average price over specific time frames. To put it simply, they follow price movements, smoothen price volatilities, and eliminate unwanted elements so that traders can concentrate on main trends and not corrections.
The moving average does not predict price movements in the future. Rather, it indicates the direction in which the currency market is moving at present. It identifies trend direction and trend reversal and displays potential resistance and support levels.
Bollinger Bands – These are indicators that measure market volatility. They comprise three bands, each of which is a moving average. It traps the price in the middle band between the lower and upper bands.
Although the price can stretch to the outer lines, it happens only for a short period of time. It always returns to the mid band. When this happens the Bollinger bands move closer to one another or move away from one another. Lesser space between the bands indicates low market volatility while more space between the bands indicates high market volatility.
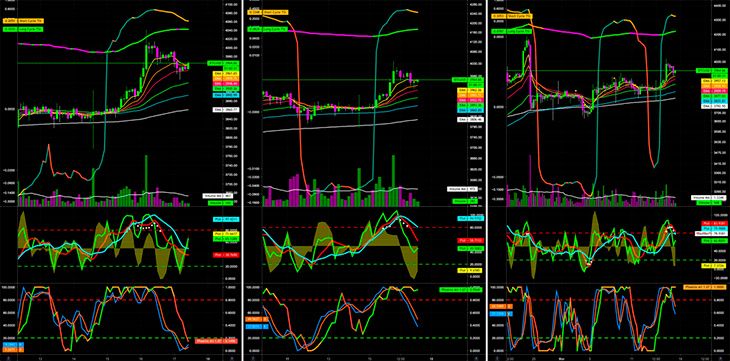
Moving Average Convergence/Divergence (MACD)
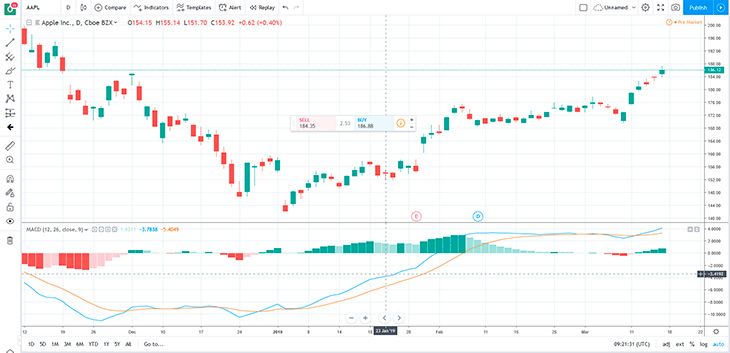
These are indicators that display market phases. They measure the forces that drive the market. It indicates the time when the currency market stops moving in a certain direction and takes a correction.
Although based on the principles of moving averages, MACD considers other formulae. This puts it in a category of technical indicators called oscillators.
Oscillators are displayed as boxes below price charts. Once an oscillator shoots up to a high level, it has to return to its original position. The price chart also displays a similar pattern. But while the MACD returns closer to zero or even lower, the decline on the price chart is smaller.
Relative Strength Index (RSI)
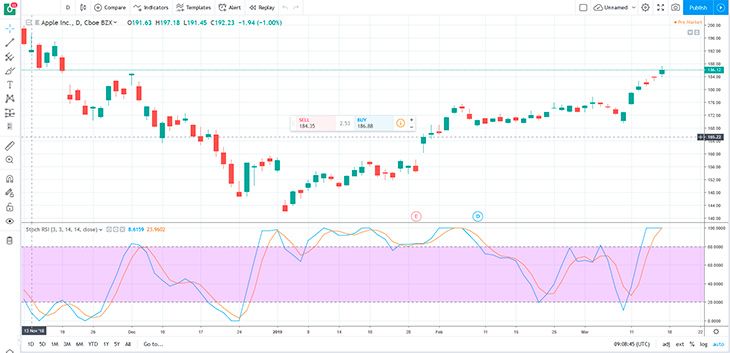
The RSI is another oscillator that is as powerful as it is simple. They help traders determine the point at which currency pairs are oversold or overbought, leading to reversals. RSIs are, therefore, great indicators for traders who purchase low and sell high.
Values ranging from 0 to 100 are used to plot RSIs. The value of 100 is considered to be overbought and the value of zero is considered to be oversold.
Are Technical Indicators Reliable?
Since all traders want to make a profit, they are eager to know if technical indicators serve as great trading signals. But the simple truth is that indicators don’t guarantee profits for traders. Instead, they serve as guides and help traders to increase their trading profits by making correct decisions. Although an experienced trader can make profits without the help of indicators, it cannot be denied that they have a great role to play in the success of many traders.
Indicators can display trends that are not that obvious, assist in creating trade ideas, and save time spent in market analysis. Forex technical indicators are based on formulae that enable quick calculations of price parameters before displaying them on the charts.
Traders, therefore, don’t have to do any calculations. They just have to visit the main menu on their trading platform, choose the Insert option, and select the indicator they want to be displayed on their chart.
However, there is a catch involved. Technical indicators consider only currency price or quotes that are recorded in the software of the trading platform. They lag behind the displayed price. So when the trader receives a signal to buy or sell from an indicator, the price will have already changed.
Where to Find Free Forex Indicators
Free forex indicators are available in plenty at top forex brokers. To avail of them, you only have to create an account at any of the following services:
IQ Option
IQoption is one of the top places to get free forex indicators. It offers trading on hundreds of financial instruments across seven classes of assets such as stocks, cryptocurrencies, forex, options, commodities, indices, and ETFs.
The trading platform offers the ultimate trading experience featuring technical analysis, multichart layouts, historical quotes, and much more. Traders can access all this on any device of their choice, including desktops and mobile devices.
IQOption provides its traders with the best trading tools, including market updates, volatility alerts, newsletters, economic calendars, stock screeners, and much more. Traders are never alone at IQOption, which is the home of hundreds and thousands of likeminded people who are willing to share ideas and inspiration.
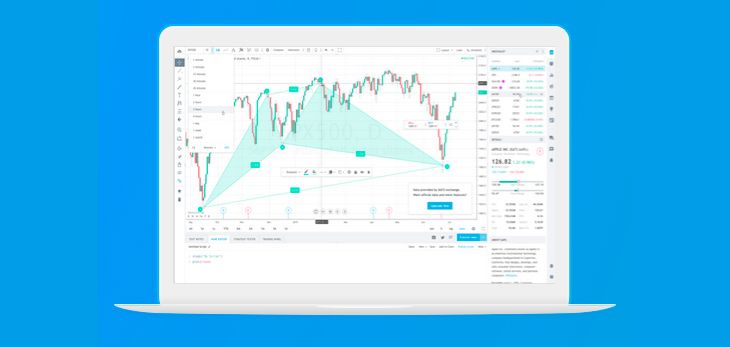
TradingView
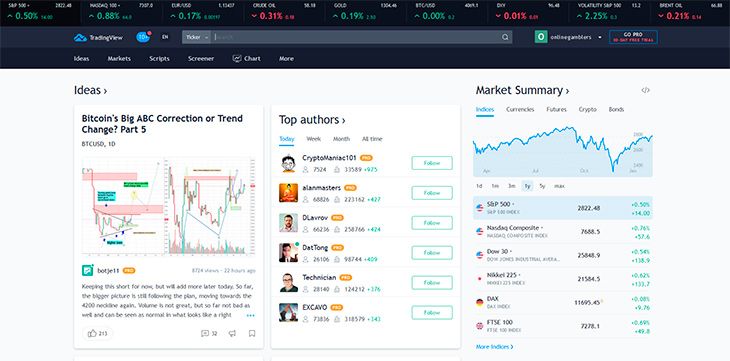
TradingView is designed for beginners as well as advanced traders. It features charting tools that social traders require to view and share the best trading ideas.
TradingView offers ten types of HTML5 charts, which help traders to analyze markets from various angles. Traders can also get alerts from the service in the form of visual pop ups, audio signals, emails, and text messages. In addition, there is a stock screener that helps traders filter stocks as per established criteria.
Conclusion
To conclude, technical indicators have advantages as well as disadvantages. So traders cannot rely on indicators alone to make a successful trade. They have to rely on their experience, research, and skills as well. Also, they cannot rely on only one type of indicator. To make the most of these useful trading tools, traders have to add at least four indicators to their charts and learn to analyze them well.
If you want to become a successful trader, you have to be willing to educate yourself continuously and steadily. Fortunately, most of the top FX brokers in the industry are not only excellent online trading platforms, but also great Forex schools. You will come across excellent educational material such as video tutorials, forex articles, webinars, and eBooks on their websites.
We suggest that you create demo accounts on these Forex brokers and learning everything about the proper use of trading tools such as indicators. This will help put you on the way to developing a successful trading career.