Successful stock traders spend a lot of their time interpreting market data displayed on screens. Online day trading wouldn’t be possible without electronic trading platforms and trading software and tools.
Independent firms as well as online brokers offer a variety of trading software to help traders make profitable decisions. If you sign up at the most reputed online brokers, you will gain access with a wide range of research, market analysis, and stock screening software.
Most software packages come with features such as fundamental analysis numbers, technical indicators, news, alerts, and integrated apps for automated trading. In fact, online brokers are considered to be the best only if they offer these trading tools.
How Stock Charts Work

Stock charts are trading tools that display important stock data such as volume, volatility, and price in the form of a graph. The simplest stock charts display price-related data in the form of a line, which changes from time to time. But complex stock charting enables traders to implement technical indicators so that they can gain a better understanding of market movements of a particular index or equity.
The most important thing in a stock chart is its trend line, which indicates how the price of a stock rises and falls within a given time frame. This trend line is usually a blue line.
You also have to understand the concepts of resistance and support. The former is highest point to which the price of a stock may rise in a given time frame, and the latter is the lowest point to which it may fall. If the price of a stock moves beyond its support and resistance points, it gets new support and resistance lines.
The trick is to buy the stock when it is at its support point and sell it when it reaches close to its resistance point. When a stock breaks its resistance, it is called breakout; and when it falls below its support line, it is called breakdown.
In brief, stock charting tells the story of a stock. You can study stock charts that show the rise and fall of a stock’s price over a period of 10 years or during the span of 60 seconds. Intraday stock charts usually display price movements over shorter time frames because intraday traders enter and exit multiple trade positions before the market closes for the day.
Best Free Stock Charting Software

Online brokers offer most of their trading tools and software free of cost, but you may have to pay for some of them. Despite online brokers’ claims of offering the best stock charting software or the best online trading platform, there is nothing called “best stock chart” or “best trading tool.”
This is because the trading world is flooded with trading preferences, styles, philosophies, ideas, strategies, and markets. You have to examine and compare a variety of stock trading charts before choosing the best of them.
If you are a new stock trader who doesn’t really know much about trading, you would be looking for a lot of free stuff. You would be eager to learn as much as possible without risking a lot of your money. In this case, free stock charting software will greatly help you to plot indicators and learn technical analysis.
So we strongly recommend getting started with free software. However, as you improve your knowledge and gain skills, you may feel the need for better stock charting software with features that allow for screening, forecasting, and back testing, all of which comes at a price.
Let us now look at the top 7 best online stock market portals and online brokers that offer free stock charting tools & software:
#1 TradingView
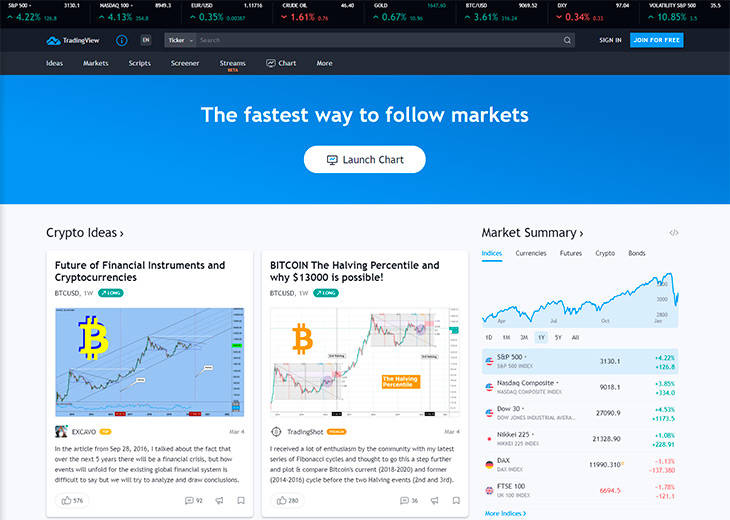
TradingView claims to be the fastest way to follow the markets and get real-time market insights and information. One of the most beginner friendly trading sites in the industry, TradingView also has a lot for advanced chartists.
TradingView can be defined as “an advanced financial visualization platform” that is as easy to use as any modern website. It offers all the data and tools required by traders irrespective of whether they are looking for something complex or simple. It is one of the liveliest social networking sites for investors and traders, giving you the rare opportunity to meet and interact with traders worldwide. Moreover, you can use TradingView on any device of your choice, including smartphones and tablets.
You will find almost every charting tool you require to view and share trading ideas at TradingView. You can do your market research from any part of the world using its browser-based charts and real-time data. And the best thing about this service is that you don’t have to undergo any complicated setup procedures or software installations.
To start using TradingView, you just have to open it on any browser and start learning, charting, and sharing trading ideas. You don’t even have to pay any fee for joining. Once you are aboard the TradingView platform, you will form part of a large community of traders. You are free to discuss trading issues, share your strategies and ideas, and learn from traders from different parts of the world.
The TradingView community comprises thousands of traders; so you will never feel lonely there. According to the figures on the TradingView website, it is home to 6,220,954 investors. So far, 3828850 ideas have been published on TradingView and 19804037 charts have been created.
TradingView offers facilities that make it easy for traders to insert charts into websites, view live charts or annotated articles published by members of the community, and share their ideas either within the community or on social networking sites.
The following are some of the features of TradingView:
- Best HTML5 Charts – You can choose from several types of charts, including spread charts and Renko, line break, Kagi, and PNF charts. Choose from over 50 drawing tools and view multiple layouts. Plot multiple symbols on the chart and compare symbols.
- Server Side Alerts – This feature enables you to get alerts on market moves. For example, you can set TradingView to send you alerts as soon as the stock you purchased drops below a certain price level. The alerts come in the form of text messages, audio signals, visual pop ups, and email alerts.
Since you get them right on your mobile phone, there is no chance of you missing any important market information. TradingView offers 12 varieties of alerts, which you can apply on drawing tools or indicators.
- Stock Screener – Stock screeners are tools that help traders pick stocks according to specified criteria.
- Customized Technical Analysis – TradingView offers 100+ pre-built studies that allow for in-depth market analysis encompassing popular indicators and trading concepts. It has created a programming language called Pine, which allows traders to create and share their own signals and studies. The best feature of Pine is that traders can easily modify its code to their convenience. They can use it to create any custom indicator from scratch.
So how much does TradingView charge for all this?
The basic version is absolutely free of charge. The pro version costs $14.95 per month, the pro+ version costs $29.95 per month, and the premium version costs $59.95 per month. The pro, pro+, and premium versions have free trials, but you can skip the free trial if you wish and pay directly.
#2 Finviz
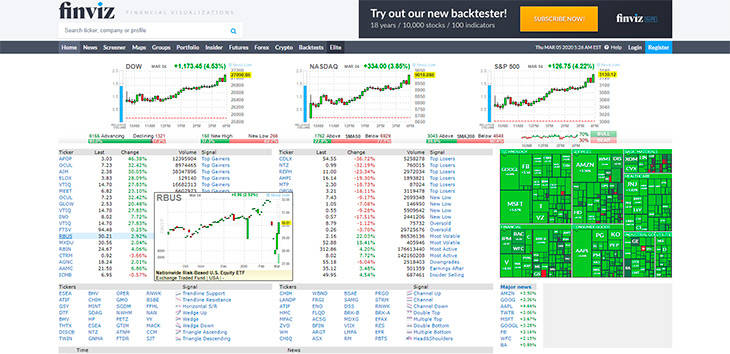
Finviz is a stock market portal with a highly limited free version. As a free user, you get delayed quotes, screening, and charts. Groups and maps are available within 3 – 5 minutes. The screener rows per page are limited to 20 tables, 36 charts, and 10 tables. So if you visit the Finviz website with the hopes of finding some excellent free stuff, you are going to be disappointed.
The fattiest parts of Finviz are reserved not even for its registered traders. When you register a free account at Finviz, you gain access to all that is available to the guests. But you can enjoy the added benefits of up to 50 portfolios, up to 50 tickets per portfolio, and up to 50 stock screener presets.
If you subscribe to Finviz Elite for a hefty sum of $24.96 per month, you will gain access to the following features:
- Real-time premarket data and stock quotes
- Advanced charts
- Back tests
- Advanced screener
- Correlations
- Alerts & notifications
- A sophisticated ad-free layout
So if you want to get the best of Finviz, you have to become a paid subscriber of its services.
Here are a few Finviz FAQs that will help you understand the situation better:
Q1: Does Finviz offer free trials?
A: No, Finviz does not offer any free trials, but invites you to request a refund if you are not satisfied with its services. However, this applies only to its monthly subscription plan.
Q2: What markets does Finviz cover?
A: Finviz covers the US markets Amex, NASDAQ, and NYSE.
Q3: How often does Finviz update its data?
A: In its regular version, Finviz delays stock quotes by 15 minutes for NASDAQ and 20 minutes for Amex and NYSE. It also delays futures data by 20 minutes.
In its elite version, traders get real-time stock quotes that are refreshed every few seconds, but the futures data is delayed for 20 minutes.
The site recalculates and updates all other data on Monday mornings after taking into account the latest information.
Q4: Does the Finviz stock screener show historical data?
A: No, it shows only the latest information. You cannot create screens for any day in the past.
Q5: Does Finviz automatically renew subscription?
A: Finviz continues to automatically renew your subscription till you manually cancel it.
#3 Robinhood
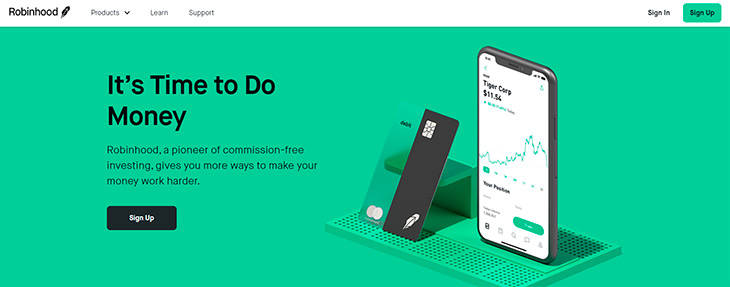
Robinhood is a very simple, beginner friendly commission-free online broker, which appears to operate on the mission of “democratizing the financial system.”
The online brokerage service was launched in Stanford ten years ago by two graduates Vlad and Baiju. In the course of a lucrative and eventful finance career, the duo realized that large Wall Street firms pay absolutely nothing to trade stocks, but US residents had to pay as much as $10 on every share they trade.
They, therefore, decided to create a product that would make the trading world as fair and accessible to the common person as possible, and Robinhood is the result. But it does not accept registrations from non-US traders as it is licensed to sell securities only in the US.
The most useful part of Robinhood is it’s learn section, where you can learn almost everything you need to know about money. The articles discuss complex financial concepts in a language that the common person can easily understand. Robinhood has a community of writers with bylines in Forbes, Bloomberg, WSJ, and other prestigious publications.
Robinhood’s product portfolio includes the following:
- Cash Management:You can earn 1.80% APY on cash that you haven’t invested.
- Stocks & Funds:Use your mobile phone to gain access to the markets. Robinhood does not charge commission.
- Options:Robinhood challenges you to go bullish on promising stocks and bearish on the declining ones.
- Gold:Trade on margin, get research reports, make larger deposits, and get quicker access to funds. You can start with as little as $5 per month.
- Crypto:Buy, hold, and sell a variety of cryptocurrencies such as Dogecoin, Ethereum, Bitcoin, or others. This market is open round the clock.
Here are some Robinhood FAQs:
Q1: How can I get started at Robinhood?
A: You should be at least 18 years old and a resident citizen of the US to get started at Robinhood. A social security number is also required.
Q2: Is Robinhood safe and secure?
A: Robinhood Financial is licensed by the SEC. It is a member of organizations such as the Financial Industry Regulatory Authority (FINRA) and the Securities Investor Protection Corporation (SIPC). The options and stocks that you hold in your Robinhood brokerage account are protected for as much as $500,000.
Q3: Tell me something about Robinhood’s referral program.
A: You will get a fourth bonus stock in your account whenever you invite three friends to join Robinhood. The online broker chooses free stocks randomly from its shares inventory.
Q4: What are Robinhood snacks?
A: It’s a trader’s daily dose of financial news. You need just three minutes to read this newsletter, which includes all the latest financial news you need to know to get started.
#4 StockCharts.com
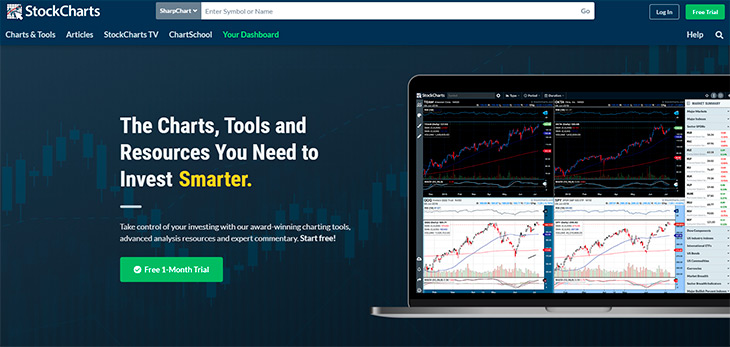
Stockcharts.com is a great source of tools, resources, and charts you require to trade smartly and invest in a strategic manner. The online stock portal invites traders to establish control over their trades with its award-winning charting tools, expert commentary, and advanced analysis resources. You can get started for free because the stocks portal offers a free one-month trial. Already, more than 1.6 million investors have signed up at StockCharts.com.
StockCharts.com offers the following charts and tools:
- SharpCharts – This is a traditional charting tool that includes line, Renko, candlesticks, bar charts, Ichimoki, and much more.
- StockChartsACP – This is a brand new full-screen, streaming advanced charting platform.
- Point & Figure – These are old school charts with Xs and Os that filter out the noise in the financial market automatically.
- Seasonality – These are charts that display the monthly price performance trends of securities over a period of time
- PerfCharts – These are charts that dynamically compare the performance of as many as 10 ticker symbols on the same chart
- CandleGlance – This is a collection of 10 mini-charts that are shown side by side to enable traders to view multiple charts at the same time
- GalleryView – These are charts in multiple time frames that allow traders to perform short, mid, and long-term analysis simultaneously.
- RRG Charts – These are charts displaying relative strength and momentum of a specific group of securities.
- MarketCarpets – They visually scan a big group of securities for interesting technical developments and emerging trends.
- Dynamic Yield Curve – This is an interactive yield curve that displays the relationship between stocks and interest rates.
Other useful features of StockCharts.com are its collection of informative and educational articles, StockCharts TV, and ChartSchool, an extensive source of education and information for investors at all levels. The ChartSchool teaches you everything you need to know about investing.
And how much should you spend for all this?
StockCharts.com is not a free service, but they give you a one-month free trial. If you are happy with the services, you can subscribe to Basic, Extra, or Pro subscriptions. The Basic subscription will cost you $14.95 per month; the Extra subscription will cost you $24.95 per month; and the Pro subscription will cost you $39.95 per month.
The following are some StockCharts FAQs:
Q1: How does the one-month free trial work at StockCharts.com?
A: Your first month at StockCharts.com is absolutely free. You can withdraw whenever you wish during the month and StockCharts.com will not charge you.
After the free trial period, your account will be automatically turned into an Extra account, but you can change your subscription whenever you please. The online stock charting site automatically renews your subscription every month till you manually cancel it.
Q2: What types of charts can be created at StockCharts.com?
A: You can create a variety of charts such as daily, intraday, weekly, quarterly, monthly, and annual price charts, seasonality charts, point & figure charts, interactive PerfCharts, relative rotation graphs (RRG), and many others.
Q3: What exchanges does the stock charting portal cover?
A: StockCharts.com offers financial charts for US and Canadian stocks, US mutual funds, Indian stocks, UK stocks, and a wide range of cryptocurrencies. In addition, it offers 1000+ technical market indicators and indices and end-of-day charts for a majority of US commodities.
Q4: Is StockCharts.com compatible with mobile devices?
A: StockCharts.com is compatible with iOS and Android smartphones and tablets.
Q5: Does StockCharts.com offer free tools and charts for unregistered traders?
A: Yes, you can explore StockCharts.com’s free tools, commentaries, charts, and resources even as a guest. You don’t need any account to use a number of resources at the website.
#5 Yahoo Finance
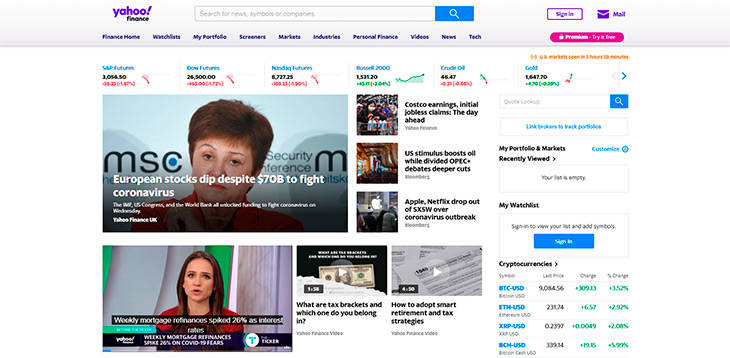
Yahoo! Finance was established shortly after the launch of Yahoo! in 1994. Yahoo! claims that its finance portal is one of the top financial and business news products. The service, which started as desktop only, can now be accessed on smartphones and tablets.
Yahoo! Finance aims at helping traders make informed financial and investment moves. It provides a wide range of apps and financial data to help traders get accurate and up-to-date market information. Yahoo! Finance is clean and uncluttered although it has a lot of content.
Yahoo! Finance offers all the basic tools that an investor needs, absolutely free of charge. Its homepage is loaded with the latest financial events and news, commodity prices, exchange rates, bond yields, and so on.
If you click on Markets, you can choose from links such as cryptocurrencies, calendar, world indices, gainers and losers, most actives, currencies, mutual funds, commodities, and most traded options by volume. You can also use the search box at the top of the website to find the latest news or data for symbols and companies.
Another interesting feature of Yahoo! Finance is My Portfolio, where you can store the stocks you are watching and manage your portfolio.
#6 CNN Money
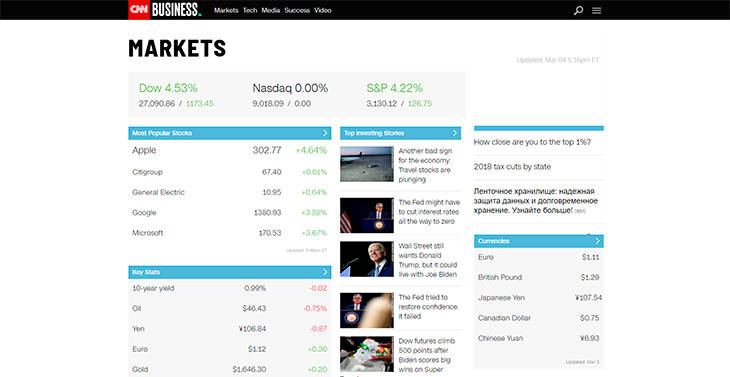
Compared to Yahoo! Finance, CNN Money is simpler, though free. When you land on its homepage, you can view a list of most popular stocks from exchanges all over the world along with leading investment stories. The website is clean, uncluttered, and mobile friendly. If you click on the menu symbol on the right, a wide range of links, including markets spring to view.
The Markets section includes data related to pre-markets, after hours, Dow 30, world markets, market movers, markets now, before the bell, leading indicators, and much more. CNN Money may not be as extensive as Yahoo! Finance, but it definitely gives traders the required market data and stock charts without charging any fees.
#7 Stock Rover
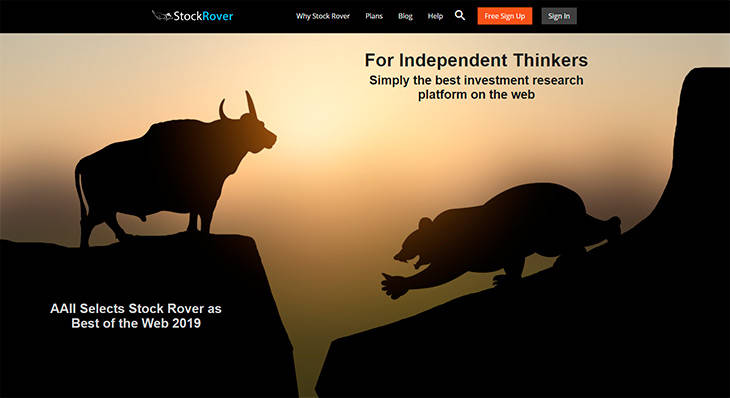
Stock Rover is a large online resource of context-appropriate and useful market information. Launched in 2008 by two software engineers called Andrew Martin and Howard Reisman, Stock Rover is a sophisticated web app that aims to simplify and improve the way investors research the markets, track their portfolios, and pick their stocks.
Stock Rover is great at stock & ETF comparison, portfolio analytics, and screening. In addition, it offers features such as real-time alerts, advanced stock charting, earnings calendars, stock ratings, brokerage integration, and a lot more.
Stock Rover’s product portfolio includes the following:
- Screening Strategies: Stock Rover’s ETF and stock screeners help you pick the best stock for screening. They are fast and efficient tools that sift the best from thousands of stocks worldwide. You can use the investment strategies of famous investors such as Peter Lynch, Joel Greenblatt, and Benjamin Graham.
- Stock Research: Stock Rover offers an affordable and integrated program that enables traders to perform an in-depth and comparative analysis of the stocks they have picked. Its Insight panel provides detailed financial statements, fundamental data, earnings, sales, dividend analysis, cash flow, company news, analyst ratings, earnings transcripts, and a lot more.
It also has a warnings feature, which alerts traders to trends such as declining earnings, falling sales, and other worrying details. There is also a Stock Ratings facility that gives each stock a grade to make it easy for traders to compare and evaluate a variety of opportunities. Stock Rover presents comprehensive information in a pleasing and easy-to-understand manner.
- Stock Charting: Stock Rover offers capable and easy-to-use chart controls. Stock charting at Stock Rover shows you how your portfolio is performing, along with benchmark comparisons, events and technical indicators such as simple moving averages, Bollinger Bands, Relative Strength Index (RSI), and others.
- Portfolio Management: You can use tools such as performance information, portfolio analysis tools, email performance reports, trade planning, correlation tools, and others to keep an eye on your portfolio. You can easily import your portfolio into Stock Rover and get daily, weekly, and monthly reports on it through email.
How much does all this cost?
Stock Rover has a completely free plan and three paid plans—Essential, Premium, and Premium Plus. You can get all the following features for free:
- Data on 10,000+ North American stocks
- Coverage of 3000+ ETFs and 40,000+ mutual funds
- Portfolio integration
- Portfolio management
- Charting capabilities
- News on markets, ETFs, stocks, commodities, and bonds
- Individual stock news and in-depth market news
- Daily analyst ratings
- Earnings calendar
- Trading ideas
If you are looking for advanced features, you have to go in for the paid plans. The Essentials Plan costs $59.99 the first year, the Premium Plan costs $134.99 the first year, and the Premium Plus plan costs $209.00 the first year.
Learn to Read Stock Charts

Learning to read and interpret the data displayed on stock charts is just as important as finding free stock charting tools & software. The following is a brief guide to reading stock charts.
- Trend Line: The trend line is the blue line you see on a stock chart. Although it is self-explanatory and indicates the rise and fall in the price of a stock within a given time frame, you should be able to interpret it in the right way.
Stocks keep climbing and diving in a way that may alarm beginners; however, you cannot let the trend line play with your emotions. Avoid over reacting to large gains and deep drops. You should study the stock chart only to get a general idea of what is happening to the stock and the company that has issued it.
If you see the trend line plunging, you have to conduct some research to find out what exactly is happening to the company. If it is a large company, it is sure to bounce back and start climbing once again. So the trend line becomes a high-level indicator of something that requires further research.
- Resistance and Support: You also need to study the resistance and support lines. The stock price is expected to stay within the limits of these lines for a given period of time. Support refers to the lowest point the stock price may fall, and resistance refers to the highest point the stock price may rise. In case of major changes, the stock price may fall below support or rise above resistance.
If you understand and interpret the lines of support and resistance, you will be able to decide exactly when to buy and sell a stock. However, you cannot just follow these lines blindly. Your decision should also be based on market research and analysis.
- Stock Splits and Dividends: The bottom of stock charts displays data of company dividends and stock splits. Dividends are portions of company profits distributed among its shareholders. If you hold company shares, you will get dividends on it.
Not all companies give dividends; some prefer to invest the profits into their growth and development. Many large companies have the ability to give dividends and continue to grow at the same time.
Companies may also make the strategic move of splitting their stock so that they can issue more shares to public investors. Although the company value does not undergo any changes, the price of each share in its stock may. If the price of each share decreases, it may attract small investors who may buy it in large quantities and boost its price.
- Historic Trading Volumes: The little vertical lines displayed at the bottom of the stock chart indicate volume trends. It is good to know the volume of the stock you would like to trade, but volume is not the only factor you should consider when you pick stocks to trade.
Trading volumes usually shoot up whenever some news is published about the company. The good thing about volume is that you can always find buyers and sellers while trading high volume stocks.
Conclusion – Free Stock Charts or Paid Stock Charts?
There are plenty of free stock charting platforms on the Internet, but they come with limitations. Some of them require traders to upgrade to unlock additional functionalities and features. Since they are limited, they may not display the latest information. The data they do display may also be incomplete.
Free charting tools also come with a delay of 15 minutes, which makes them useless for day traders. Since free charts display limited information from the exchanges, you will also not get the correct volume of a stock. If you invest in good stock charting software, you can enjoy reliable features such as live updates, real-time market prices, and extra features.
However, your real-time stock data requirements depend a great deal on your trading style. If you are a day trader, your need for real-time data is great as you will be holding the stock for just a few minutes to a few hours. If you are a trend trader, you don’t need frequently updated data as you would be holding the stock a few days to a few weeks.
Irrespective of your trading style, however, you will still need to have access to the best charting tools if you want to become a successful trader. You also need to be able to read charts and interpret them properly.